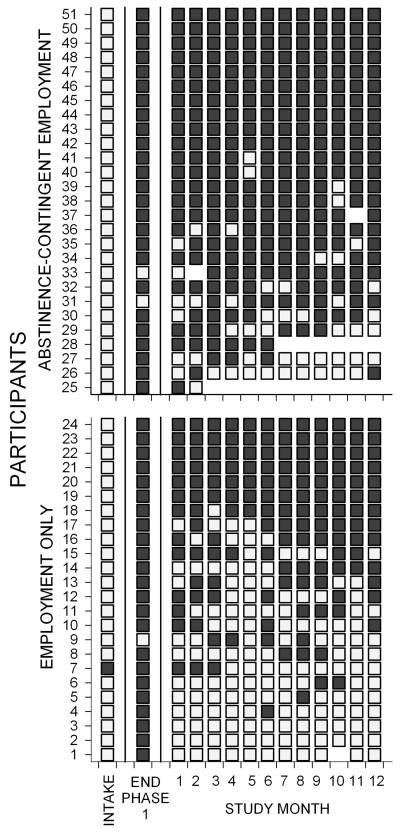
Figure 1.
Cocaine urinalysis results at intake, end of phase 1, and across consecutive months during the intervention (phase 2). Within each panel, rows of data represent the cocaine urinalysis results for individual participants. Filled squares indicate cocaine-negative urine samples, and open squares indicate cocaine positive urine samples. Empty sections indicate missing samples. Within each panel, participants are arranged from those showing the least abstinence (fewest cocaine-negative urine samples) on the bottom to those with the most abstinence on the top.

