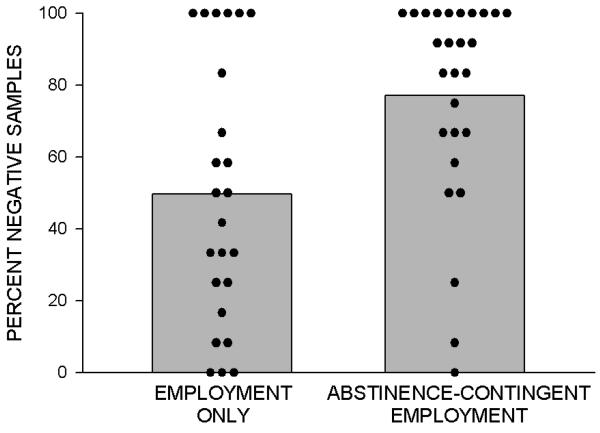
Figure 2.
Percentage of urine samples negative for cocaine and opiates during the year of intervention (phase 2) for employment only (left) and abstinence-contingent employment (right) groups. Bars show group means, and filled circles show percentages for individual participants. Data are based on results of monthly urinalysis. All missing samples were considered positive.

