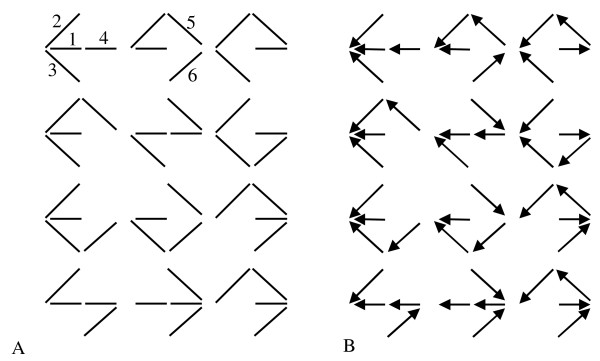
Figure 2.
The graph representation of the valid reaction patterns generated by the King-Altman (KA) method. (A) Valid KA patterns. (B) Directional diagrams associated with the enzyme state 1. The numbers in plot A are the indexes of the links in the linear graph representation of the mechanism. Using the cut matrix method introduced in the text, one can easily get that the number of valid KA patterns is 12. Accordingly, the number of directional diagrams associated with the 5 enzyme states is 5 × 12 = 60.

