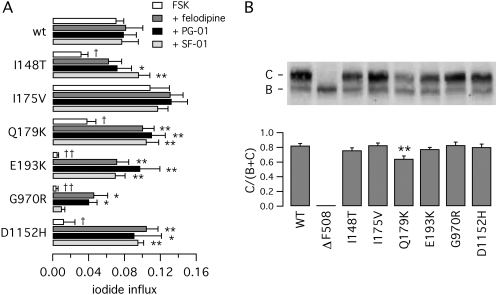
Fig. 1.
Functional and biochemical characterization of CFTR mutants. A, anion transport measured in COS-7 cells with the fluorescence YFP assay. Cells were transfected with wild-type or mutant CFTR as indicated. Before the assay, cells were stimulated with forskolin (FSK, 20 μM) with and without 5 μM felodipine, PG-01, or SF-01. Bars represent the average ± S.E.M. of 4 to 8 experiments. *, p < 0.05; **, < 0.01 versus forskolin alone of the same mutant. †, p < 0.05; ††, p < 0.01 versus forskolin alone of wild-type CFTR. B, analysis of CFTR maturation by Western blot experiments. The top shows a representative experiment. The positions of mature (band C) and immature (band B) forms of CFTR protein are indicated. The bottom summarizes the results of Western blot experiments as band C intensity normalized for total CFTR protein (mean ± S.E.M., n = 5–11). **, p < 0.01 versus wild-type CFTR.

