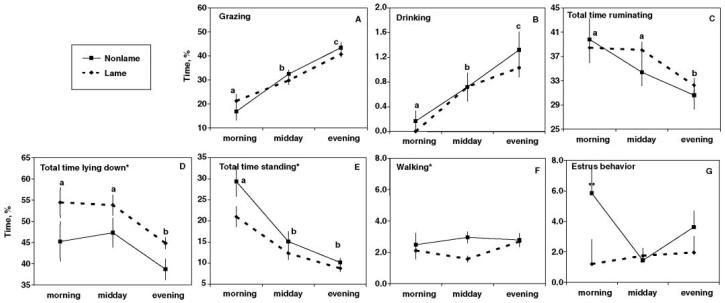
Figure 1.
Daily time budgets for lame (n = 39) or nonlame (n = 20) during the morning, midday, and evening, including proportion of scan samples (%) spent A) grazing, B) drinking, C) ruminating (total includes standing or lying ruminating), D) lying down (total includes with or without ruminating), E) standing (total includes with or without ruminating), F) walking, and G) observation of an estrus behavior. *Indicates behavioral state where lameness was an explanatory variable in the statistical model (P < 0.05); abc indicates differences between the morning, midday, and evening periods for all cows (lame and nonlame; P < 0.05); ** indicates the difference between lame and nonlame cows at different periods (P < 0.05; only seen in estrus behavior).

