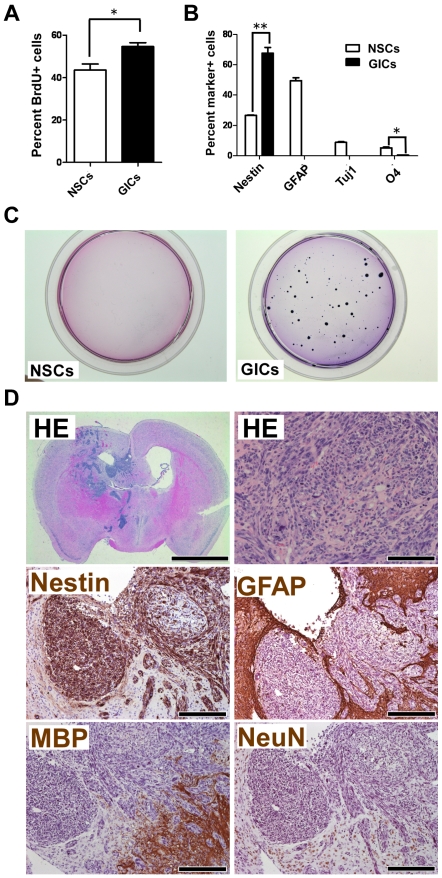
Figure 4. Characteristics of the GICs-LD.
(A) Proliferation of the GICs-LD and their parental cells (NSCs) was determined by BrdU incorporation assay. The results shown are the mean±SD of three cultures. *P<0.05. (B) The proportion of neural lineage marker-positive cells is shown as the mean±SD of two cultures. *P<0.05; **P<0.01. (C) Colony formation ability was examined in soft agar. (D) Brain sections with tumors derived from GICs-LD were stained with hematoxylin and eosin (HE) and for Nestin, GFAP, MBP, and NeuN. Scales, 2 mm (upper left panel), 100 µm (upper right panel), and 200 µm (middle and lower panels).

