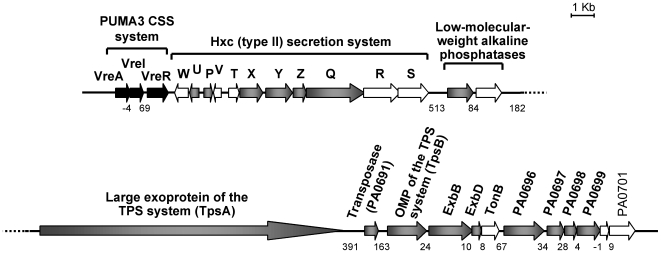
Figure 2. Genetic organization of the PUMA3 CSS system (black arrows) and part of the VreI (PA0675) regulon (grey arrows).
Induction was determined by microarray analysis (Table 1). The arrows represent the different genes and their transcriptional orientation. Above each gene, the name of the encoded protein or the PA number (http://www.pseudomonas.com) is indicated. Numbers below the map indicate the distance (in base pairs) between adjacent genes; negative numbers indicate that the genes overlap the indicated number of base pairs. CSS, cell-surface signaling; TPS, two-partner secretion; OMP, outer membrane protein.

