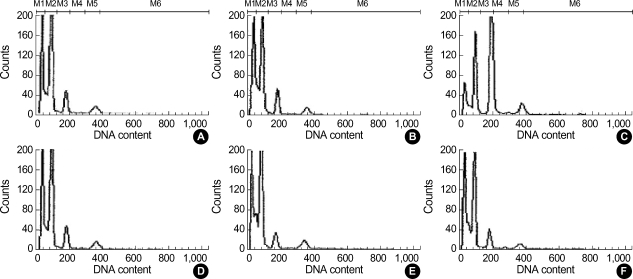
Fig. 3.
DNA histograms of testicular cell suspension from flow cytometric analysis in rats receiving cadmium 0 mg/kg (A), 1 mg/kg (B) and 2 mg/kg (C). Disclosea peaks are for haploid elongated spermatid (M1), haploid round spermatid (M2), diploid germ cells and non-germ cells (M3), tetraploid germ cells (M5). Corresponding histograms for rats receiving α-tocopherol in addition are show in (D), (E) and (F).

