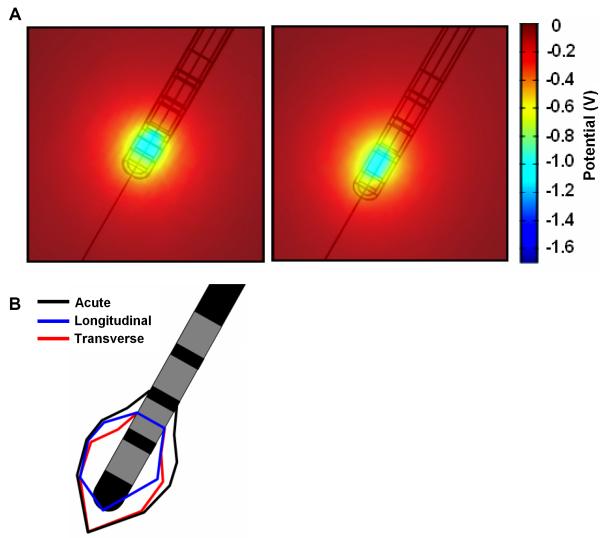
Figure 5.
(A) Induced potential distribution at two possible transitional periods, when giant cells have grown transversely over all but the tip of the electrode (left), and longitudinally over half of the length of the electrode (right). (B) Comparison of the estimated area of neuronal tissue being activated by a threshold of 0.5V between the acute and two putative transition cases.

