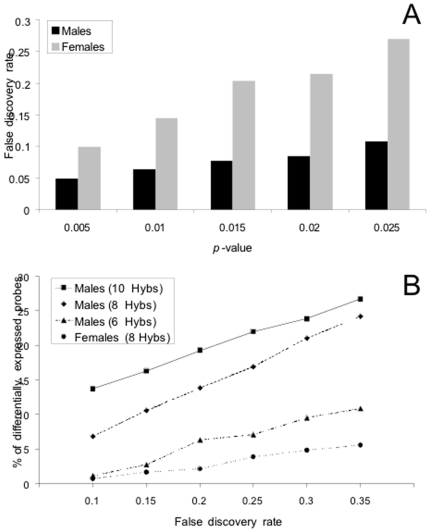
Figure 1. Comparative statistical analysis of the male and female experiments.
(A) False discovery rates corresponding to several P-value cut-offs for both experiments. (B) Proportion of probes detected as differentially expressed at different false discovery rates. For the male experiment hybridizations which showed the best quality (defined as the number of spots with significant signal above background) were successively removed in order to determine the effect of replication on the detection of expression differences.

