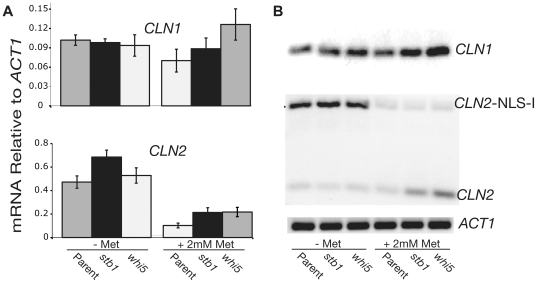
Figure 3. Analysis of CLN1 and CLN2 expression in the cln3 bck2 stb1 and cln3 bck2 whi5 strains.
qPCR was used to measure the expression of CLN1 and CLN2 in two of the suppressor strains. The parental strain is cln3 bck2 rme1 {MET-CLN2} (N497), and the two suppressor strains have, in addition, stb1 (N451) or whi5 (N499), as indicated. (A) The left panel shows quantitation of CLN1 and CLN2 mRNAs by qPCR, in the absence (−met) or presence (+met) of methionine. (B) The right panel shows the PCR products from (A) separated by agarose gel electorphoresis. The plasmid-borne allele of CLN2 is CLN2-NLS-I; it carries a tag that increases the length of the mRNA and the PCR product, allowing expression of genomic CLN2 to be distinguished from expression of plasmid-borne MET-CLN2-NLS-I. This demonstrates that the increased CLN2 expression caused by stb1 and whi5 is specific for the genomic copy of CLN2. The qPCR measurement in (A) includes both forms of CLN2, suggesting that the increased expression of genomic CLN2 in the stb1 and whi5 mutants is about 3-fold. The primers for amplification of ACT1 flank the ACT1 intron, yet only the mRNA-specific band was obtained, showing that no DNA was present in the RNA preparation. Error bars show the standard error of the mean.

