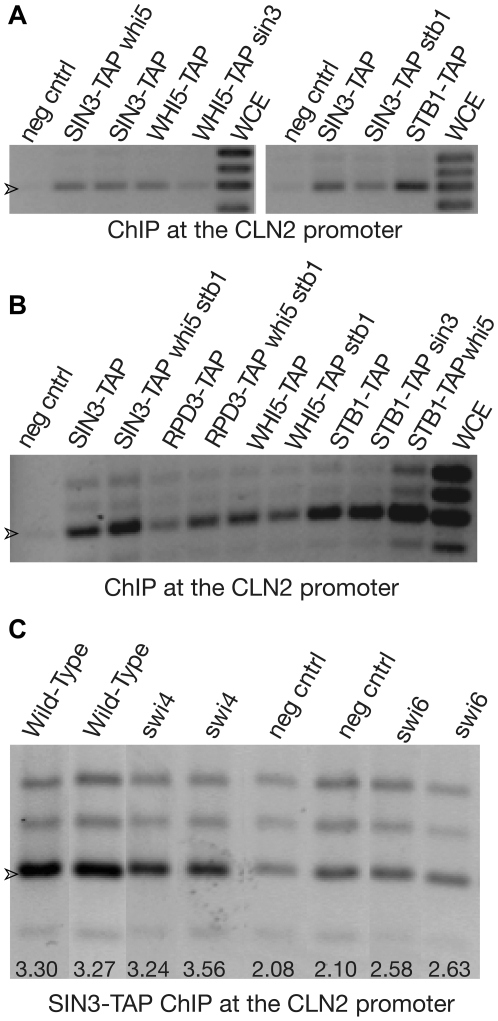
Figure 5. Dependency analysis.
(A) ChIP analysis of proteins at the CLN2 promoter in various mutants. Cells (left panel: S288c, HWL99, HWL110, OBS1, and HWL117; right panel S288c, HWL110, HWL119, and OBS5) were CLN3 BCK2 CDC34 in exponential growth. The TAP-tagged protein being assayed is indicated, as is any additional mutation in the strain. The arrowhead (>) indicates the band containing the SBF binding sites. Other bands are as drawn in Figure 4A. (B) ChIP analysis of proteins at the CLN2 promoter in various mutants. As in Figure 4A, but with a different selection of mutants. The arrowhead indicates the band containing the SBF binding sites. (C) ChIP analysis of Sin3-TAP at the CLN2 promoter in wild-type, swi4, swi6, and untagged (negative control) strains. Ten independent experiments were done for each of the four genotypes. Results for all 40 experiments were obtained and tested statistically after “blinding” the samples (Table 1). The two median-most experiments for each of the four genotypes are shown here. The ratio of the intensity of the SBF band (arrowhead) to the sum of the intensities of the upper two bands (“dyn” plus “up”) is shown at the bottom of each gel lane.

