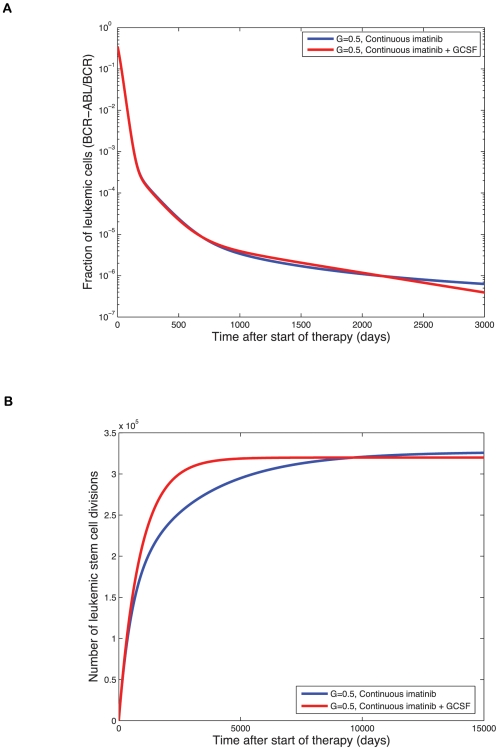
Figure 5. Long-term effects of therapy.
(A) We show the long-term dynamics of leukemic cells in peripheral blood, BCR-ABL/BCR (%), during continuous imatinib therapy with (red line) and without (blue line) G-CSF. We plot  since normal cells have two alleles of BCR while leukemic cells have only one. Treatment starts on day zero and leads to a tri-phasic depletion of the leukemic cell burden if imatinib is capable of depleting leukemic stem cells. Although the addition of G-CSF initially increases the number of terminally differentiated leukemic cells, the long-term trend reveals that adding G-CSF does result in a faster rate of depletion of the leukemic cell burden and eventually leads to smaller numbers of terminally differentiated leukemic cells. The initial equilibrium frequency of cycling stem cells is
  with
with  and
and  (all other parameters are as in Fig. 4). (B) We show the long-term simulation results for the number of leukemic stem cell divisions during continuous imatinib therapy with (red line) and without (blue line) G-CSF. This number is directly proportional to the risk of resistance to therapy. Until the crossover point of about 10,000 days, imatinib therapy leads to a lower number of stem cell divisions and therefore to a lower probability of resistance. After the crossover point, combination therapy with imatinib and G-CSF leads to a lower risk of resistance. All parameter values are as above.

