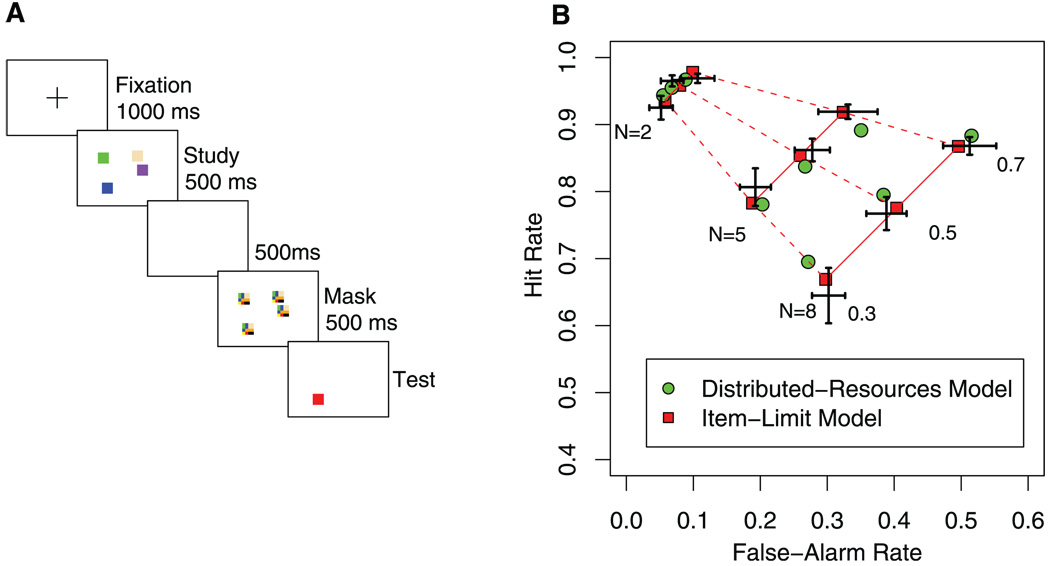
Fig. 2.
Procedure and data from Rouder et al. (2), with model fits from the item-limit and distributed-resources models. (A) On each trial, an array of differently colored squares was followed by a blank interval and then a post-perceptual mask. This mask was followed by a single-item probe, which the participants classified as the same as or different from the corresponding study square. The number of squares in the study array was 2, 5, or 8, and the base rate for a change (altered across trial blocks and known to participants) was 0.3, 0.5, or 0.7. Drawing is not to scale. (B) Receiver operating characteristics. Group results from (2) and averaged predictions for two models. Crosses reflect the data ± SEM on both axes. The averaged predictions of the item-limit model are denoted by the red squares. In this model, the predictions for each array size fall along a different solid line (with slope 1), and the predictions for each base rate fall along a different dashed line. The averaged predictions of the distributed-resources model results are denoted by the green circles. With five parameters per model, the results favored the item-limit model, −2 log-likelihood difference = 7.05.

