
Figure 2. Regions of interest not part of the global cortical PiB retention value.
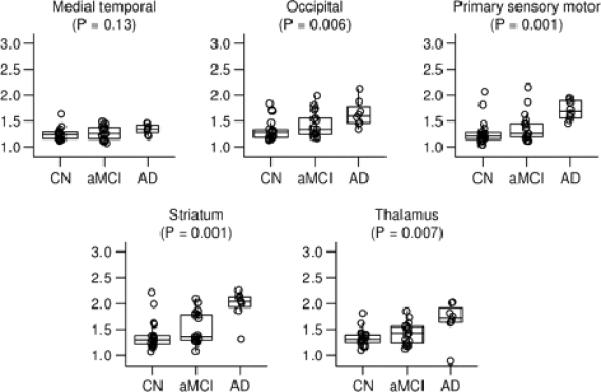
Box plots with individual data points superimposed. The horizontal lines in the box plots represent the 25th, 50th, and 75th percentiles. The vertical line extending from the box reaches the most extreme data point within 1.5 inter-quartile ranges. Individual data points represent the subject's median target-to-cerebellar ratio over all voxels in the region of interest. The p-value shown is based on the three-sample Kruskal-Wallis test.