
Figure 3. Group-wise separation for global cortical PiB and hippocampal W score.
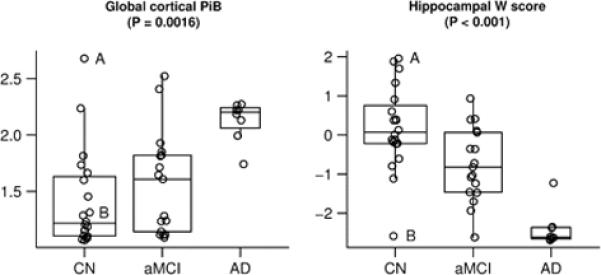
Box plots with individual data points superimposed. The horizontal lines in the box plots represent the 25th, 50th, and 75th percentiles. The vertical line extending from the box reaches the most extreme data point within 1.5 inter-quartile ranges. The p-value shown is based on the three-sample Kruskal-Wallis test. The CN subject with the largest PiB value is identified by the letter “A” and the CN subject with the smallest hippocampal W score is identified by the letter “B”. These two subjects are described in detail in the text.