
Figure 7. AD vs. CN Voxel Mapping. PiB (left).
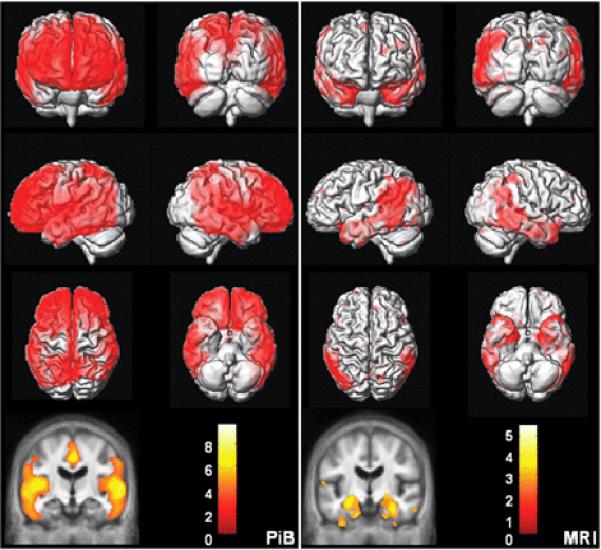
SPM of PiB retention ratio. Corrected for multiple comparisons (FDR) and thresholded at p < 0.01. MRI (right): VBM of MRI grey matter density. Uncorrected for multiple comparisons and thresholded at p < 0.01. The color bar values indicate the value of the T statistic in each display.