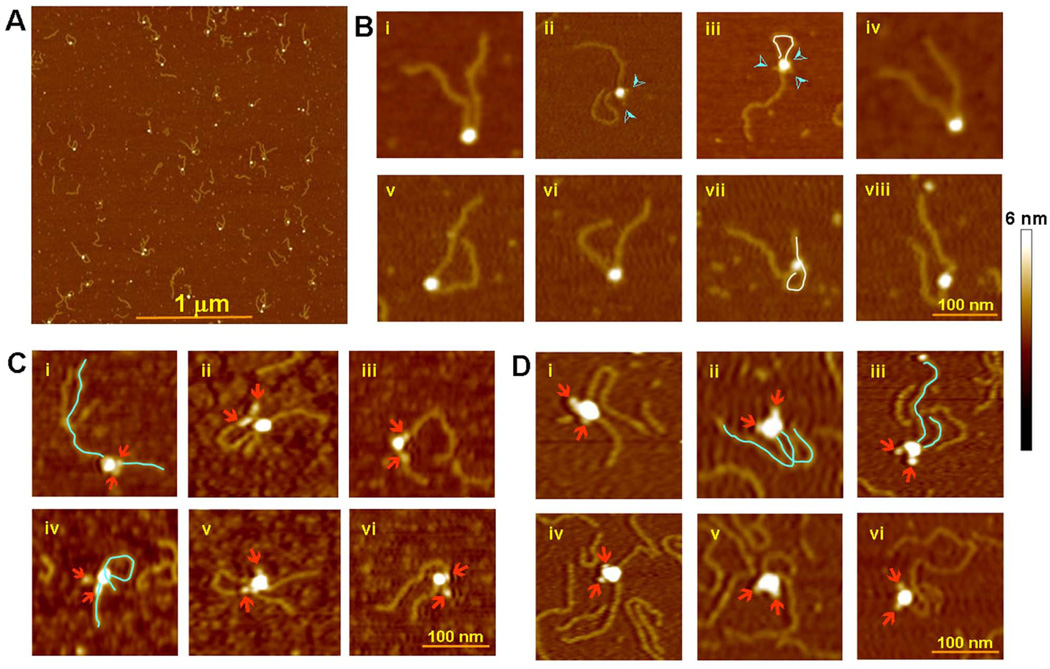
Figure 6. Atomic Force Microscopy.
(A) Population of purified SEC (MR1/LR2) with 500 bp extensions to the nonamer end of the 12 and 23 RSSs.
(B) Representative SEC particles selected from (A). The majority of images support a parallel arrangement of the RSS DNAs in the SEC. The DNA chains in a few SECs appear to exit in anti-parallel direction (iii and viii). Occasionally, one of the DNA molecules loops around and binds non-specifically to the protein core (iii and vii), delineated in white. Protrusions often seen emanating from the protein core (indicated by cyan arrowheads) are most likely the MBP domains on RAG1 and RAG2 (ii, iii).
(C) MR1/R2 SEC with 250 bp 12RSS and 500 bp 23RSS DNA. The MBPs on RAG2 were removed and the MBPs on RAG1 were labeled with Fab fragments. The Fabs (indicated by arrowheads) are generally close to the point of DNA exit in the SEC. The DNA molecules are delineated for clarity in a couple of examples.
(D) R1/MR2 SEC with 250 bp 12RSS and 500 bp 23RSS DNA. The MBPs on RAG2 were labeled with Fab fragments. MBPs on RAG1 were pre-cleaved. Notice that the Fabs are on the opposite side from the DNA exits.

