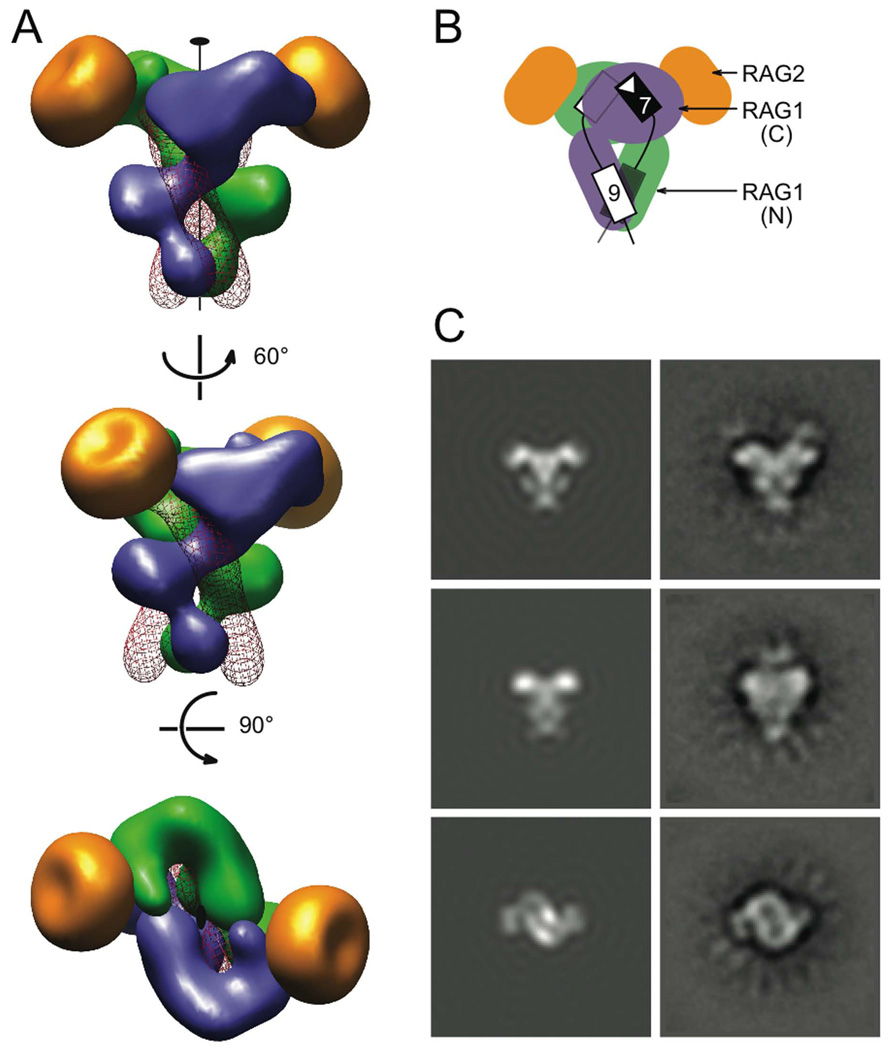
Figure 7. SEC model.
The model consists of two identical RSS DNAs, and core RAG1 and RAG2. (A) Three views of the SEC model. The two upper views are related by ~60 ° rotation around the C2 axis, and both are orthogonal to the bottom view. A RAG1 dimer (blue and green subunits), which was modeled after Tn5 transposase (PDB: 1MUR) and the HtH domains from the POU-DNA complex (PDB: 1GT0), forms the “shank” of the SEC. RAG2 molecules (gold) were modeled based on the gyrase A β-propeller domain (PDB: 1SUU). They form the tips of the “drag-end”. Two DNA molecules represented as red wires intertwine with the RAG1 dimer. The volume of each protein or DNA was calculated from the model coordinates with a filter of 25 Å resolution. (B) Cartoon depicting the location of the NBD (N) and catalytic (C) domains of RAG1, RAG2, and the DNA in the SEC. The heptamer and nonamer of the two RSSs (black and white) are shown as rectangles. (C) Comparison of 2D projections of the SEC model (left) and the EM class averages (right). The correlation coefficients for the three pairs are 0.79, 075 and 0.61 (details in SI).

