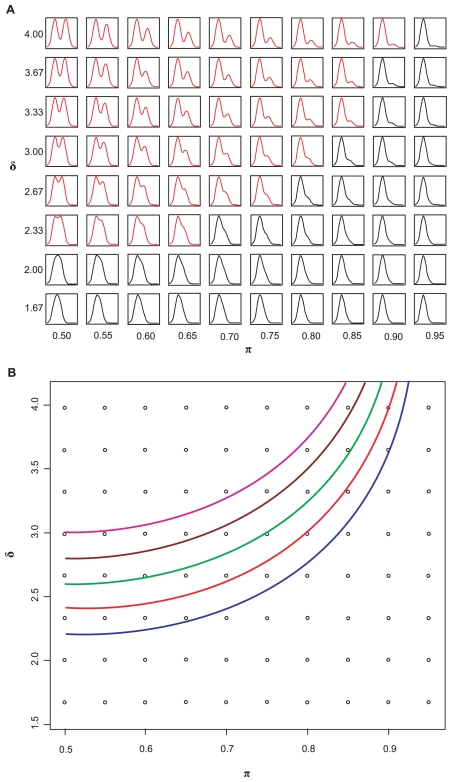
Figure 1.
Relationships between bimodality and π and δ. (A) Density plots of bimodal data as π and δ vary. These plots indicate that bimodality is obvious when both π and δ are sufficiently large, but difficult to distinguish when π and δ reach certain values. The density plots colored red are “visually” distinguishable as bimodal measurements. (B) Set of quadratic curves computed using different BI values; BI = 1.1 (blue), 1.2 (red), 1.3 (green), 1.4 (brown), and 1.5 (purple).

