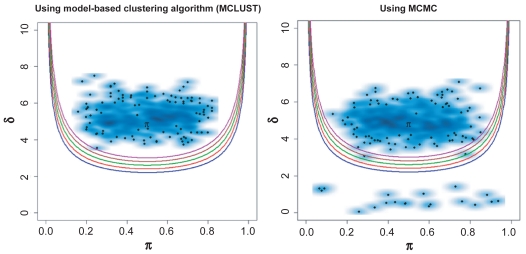
Figure 2.
Performance of the proposed method with MCLUST and MCMC techniques in a simulated strong bimodal measurement dataset, δ = 5 and π = 0.3–0.7. The dataset contains 50 samples and 500 measurements. The black spots represent individual measurement, and blue clouds indicate the density of each data point. The set of quadratic curves computed using different BI values; BI = 1.1 (blue), 1.2 (red), 1.3 (green), 1.4 (brown), and 1.5 (purple).

