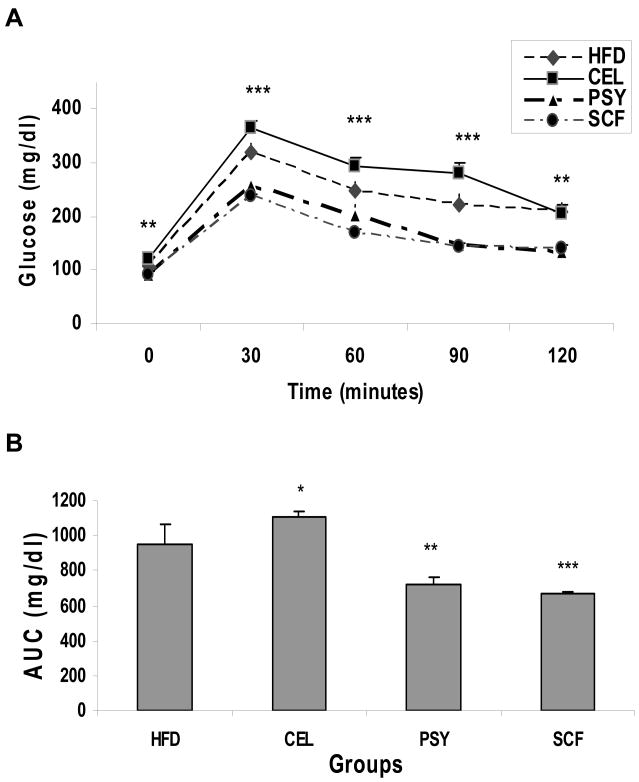
FIGURE 4.
Effects of dietary fibers and high-fat diet on IPGTT and IPITT in mice. IPGTT was done after overnight fasting as described in the methods and illustrated in the Panel A. IPITT was performed after 4 hr fasting, the area under curve (AUC) of IPITT is showed in the panel B. *P<0.05, ** P<0.01 and *** P<0.001 respectively. Mean ± SEM, SCF and PSY vs HFD or CEL groups respectively.

