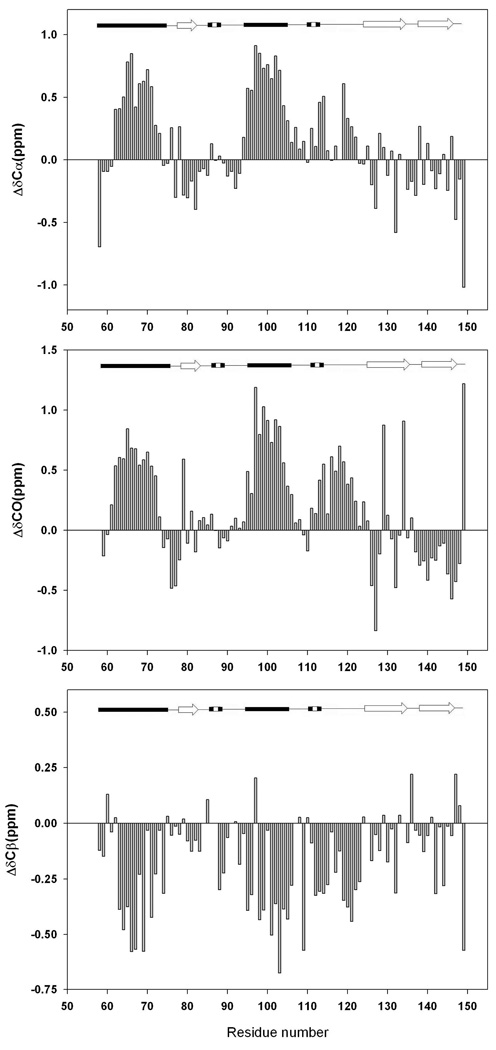
Figure-5.
Plots of the deviations of the measured 13C chemical shifts of the pH 2.5, 7.6 M urea unfolded state of CTL9 from random coil chemical values. Data plotted as observedrandom coil. (A) 13Cα chemical shifts deviations, (B) Carbonyl 13C chemical shifts deviations, (C) 13Cβ chemical shifts deviations. Random coil values in acidic (pH 2.3) 8M urea were used (28) and sequence dependent corrections were made (29). A schematic diagram of the elements of secondary structure of the native state of CTL9 is shown at the top of the figure.

