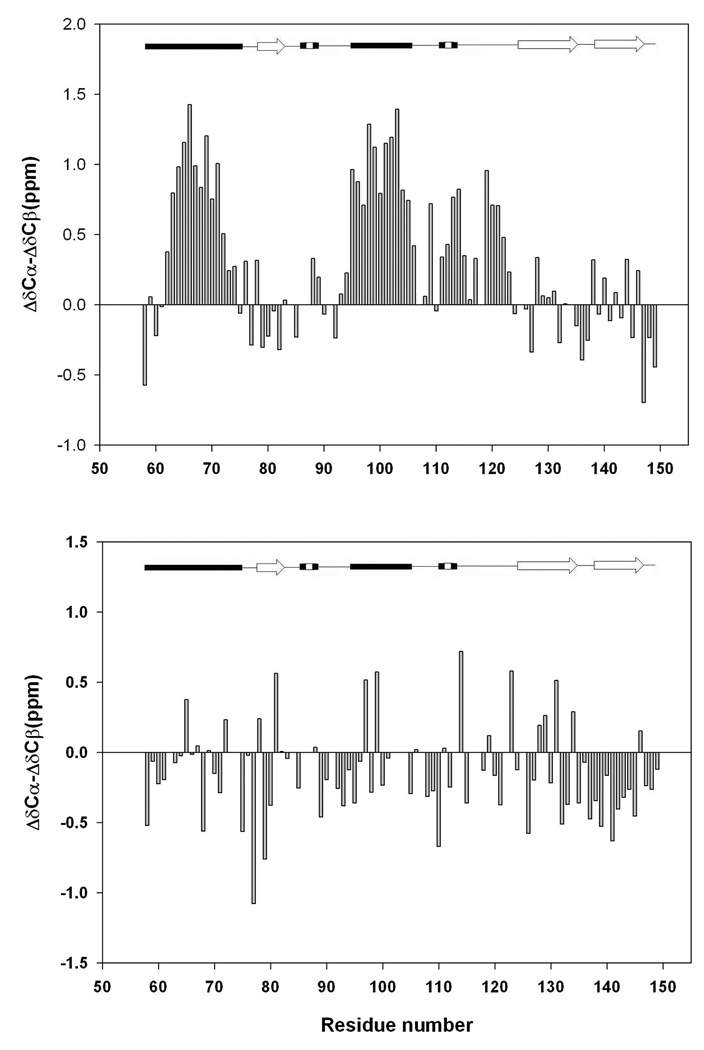
Figure-6.
A plot of the difference of the secondary shifts of the 13Cα and 13Cβ chemical shifts for (A) the pH 2.0 unfolded state of CTL9 and (B) the pH 2.5, 7.6 M urea unfolded state. A schematic diagram of the elements of secondary structure of the native state of CTL9 is shown at the top of the figure.

