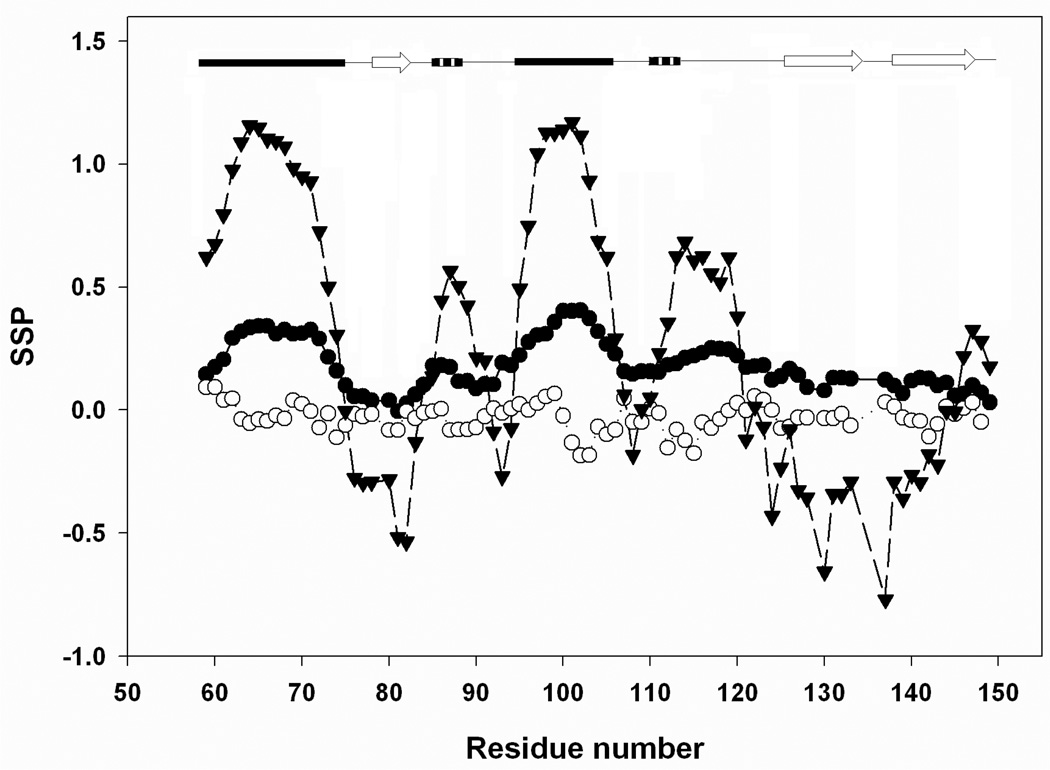
Figure-7.
SSP analysis of the pH 2.0 (●) and the pH 2.5, 7.6 M urea (○) unfolded state of CTL9 conducted using the method of Forman-Kay and coworkers (26). The calculation for the pH 3.8 native state is included for comparison (▼). Positive values represent a propensity to populate the helical region of the φ, ψ map while negative values indicate a preference for the β-sheets region. A schematic diagram of the elements of secondary structure of the native state of CTL9 is shown at the top of the figure. 13Cα, 13Cβ and Cα 1H chemical shifts were used in the analysis.

