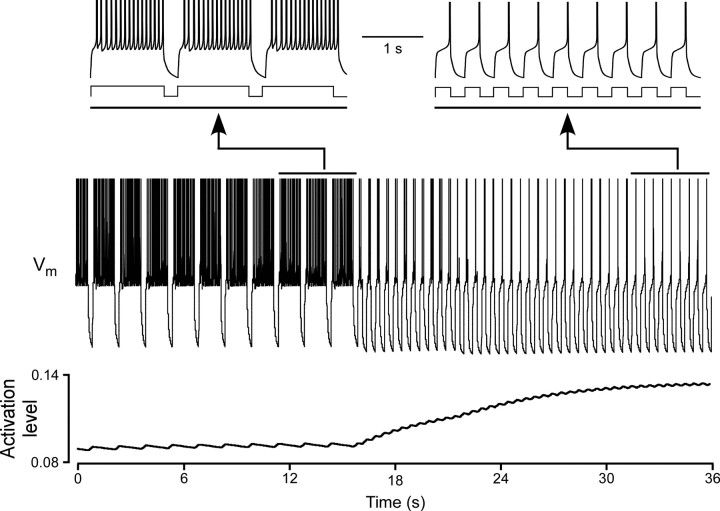
Figure 10.
When the dependence of the slow potassium conductance's activation on voltage was switched so that it increased (instead of decreased) with the same change as that done in Figure 9, the model responded with a decreased (instead of increased) rebound delay (compare left and right first traces in this figure to those in Fig. 9). All figure conventions are the same as in Figure 9.

