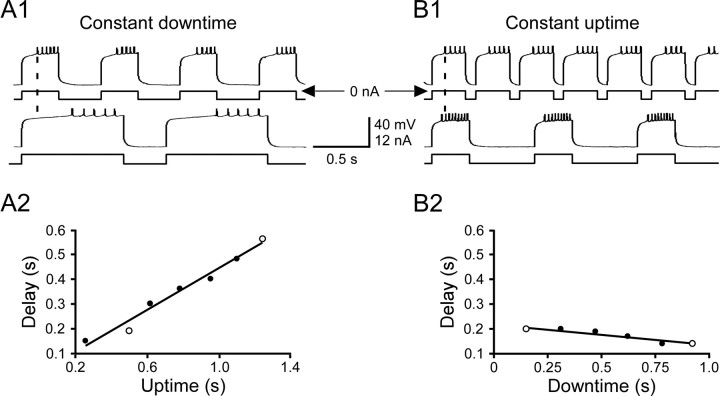
Figure 4.
Steady-state rebound delay varied with the temporal characteristics of the stimulating pattern. A, Downtime was a constant 350 ms and uptime varied from 250 to 1250 ms; rebound delay increased with uptime duration. B, Uptime was a constant 300 ms and downtime varied from 150 to 925 ms; rebound delay decreased with downtime duration. A1, B1, Raw data for the two patterns marked with open circles in A2 and B2. A2, B2, Mean summary data. Lines are linear best fits.

