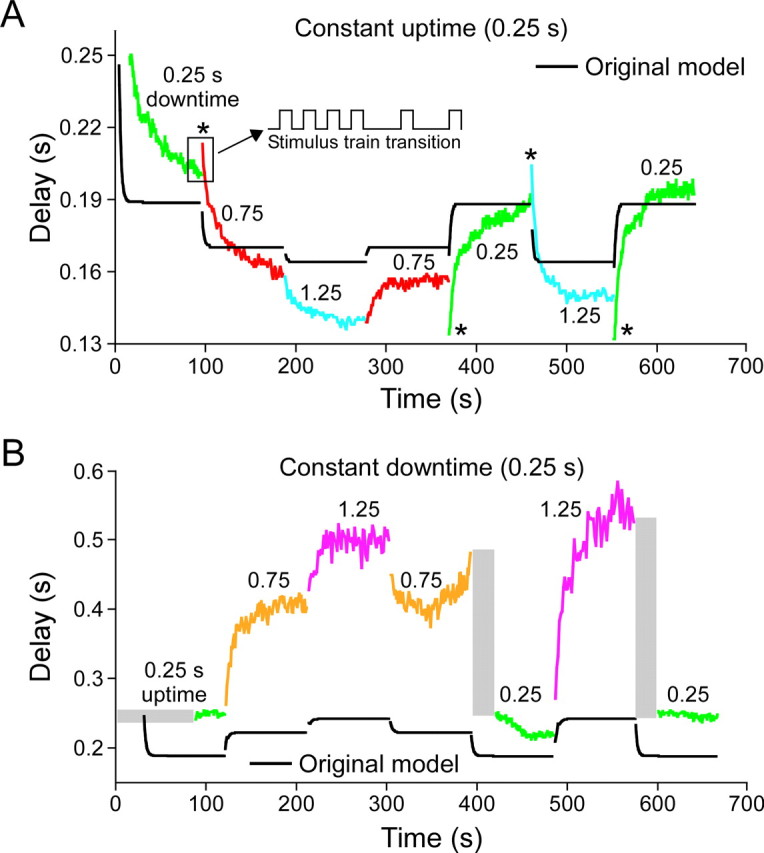
Figure 6.

Response of a PY neuron to a series of stimulation patterns (uptime and downtime values shown in panel titles and values written above each colored portion of trace) and of a pyloric neuron model (black lines). A, Responses with a constant uptime and varying downtime. B, Responses with a constant downtime and varying uptime. Asterisks mark cases in which the neuron response was biphasic. Gray rectangles mark times in which the neuron did not fire spikes. Note that the original model did not correctly reproduce steady-state rebound times, biphasic responses, or periods without neuron firing.
