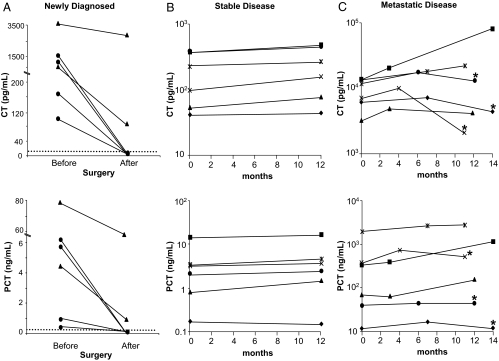
Figure 2.
A, PCT and CT concentrations in six patients newly diagnosed with MTC. Measurements were taken prior and after surgery. Three patients were tested 1 month after surgery and three patients 6 months after surgery. The circles represent patients who were disease free after surgery, and the triangles represent patients with residual metastatic disease after surgery. B, PCT and CT concentrations in six patients with stable disease. Measurements were taken 12 months apart. C, PCT and CT concentrations in six patients with metastatic disease. At least three measurements were available for each patient during a 14-month period. Asterisks represent the level of CT and PCT after 6–7 months of the initiation of ZD6474 therapy.

