
Figure 1. Family sequence alignment of the first cytoplasmic domain of EpsF and selected T2SS homologues.
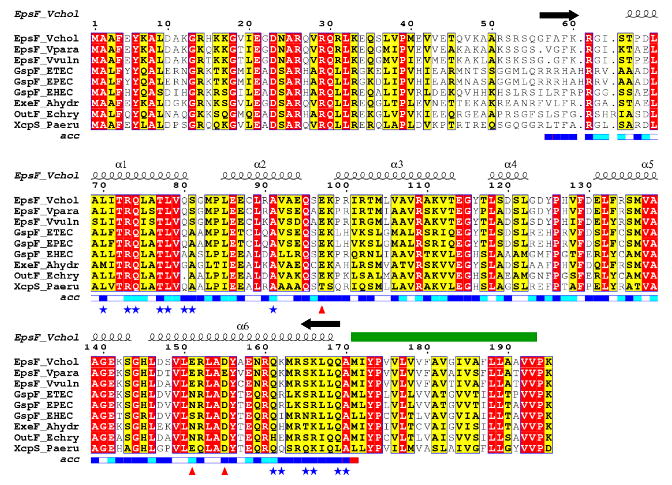
Identical residues are in red, similar residues according to the Risler matrix are in yellow. The predicted transmembrane helix (Met 171 – Val 192) is indicated with a green bar. The extent of the construct is marked with the black arrows above the sequences. The blue bar below the sequences indicates the solvent accessibility of each residue: dark blue is solvent exposed, white is buried. Residues involved in Ca2+-binding are marked with red triangles. Residues which are part of the dimer interface are marked with blue stars. Alpha-helical secondary structure symbols above the cyto1-EpsF sequence represent the observed structure in our experimental model.