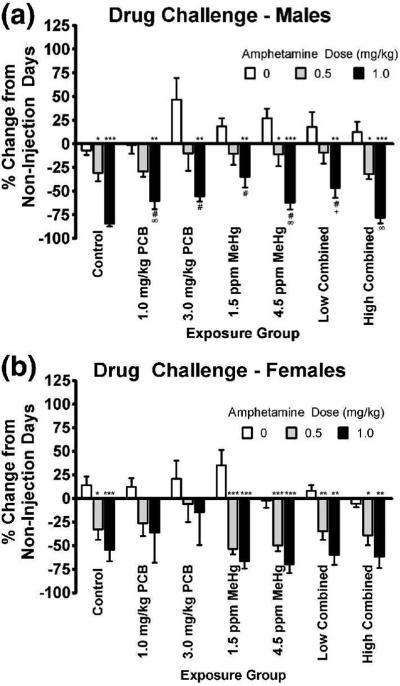
Fig. 4.
Percent change relative to non-injection days in the ratio of reinforced:non-reinforced responses as a function of amphetamine dose for the males (panel a) and females (panel b). Higher numbers represent an increase in performance relative to non-injection days. Low combined = 1.0 mg/kg PCB + 1.5 ppm MeHg, high combined = 3.0 mg/kg PCB + 4.5 ppm MeHg. Significant difference from 0 mg/kg amphetamine dose within the same exposure group at *p<0.05, **p<0.01, and ***p<0.001. Significant difference from #control group (p<0.05), ∞1.5 ppm MeHg group (p<0.05), and +high combined group (p<0.05) given 1.0 mg/kg amphetamine.

