Fig. 1.
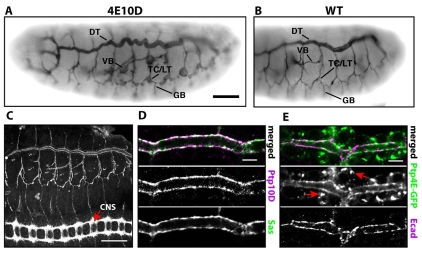
Tracheal cyst phenotype in Ptp4E Ptp10D mutant embryos, and apical localization of Ptp10D and Ptp4E in tracheae. (A,B) Stage 15 Ptp4E1 Ptp10D1 (A) and wild-type (WT) (B) whole-mount embryos stained with the tracheal lumen marker antibody mAb 2A12, using HRP immunohistochemistry for visualization. Note that Fig. 6 shows that the 2A12 antigen (visualized by immunofluorescence) is reduced in Ptp4E Ptp10D unicellular tracheal branches relative to in wild type; however, we were still able to use 2A12 to visualize these branches using HRP immunohistochemistry. The HRP reaction can be carried out until saturation is reached, and under these conditions quantitative differences will not be detected; low and high-level expression will have the same appearance. (A) VBs and TC/LT branch junction cysts are indicated. Smaller cysts are found along LT branches and GBs. The middle section of the DT is convoluted. (C-E) Localization of Ptp10D and Ptp4E. (C) In stage 15 embryos, anti-Ptp10D mAb 8B2 labels the tracheae and the CNS axon ladder (arrow). (D,E) DT segments at stage 15. (D) Ptp10D (magenta) overlaps with the apical surface marker Sas (green). (E) UAS-Ptp4E-GFP (green), expressed in the trachea from Btl-Gal4, localizes to the apical membrane and overlaps with Ecad (magenta), which is apical in the DT. There are also bright Ptp4E-GFP spots on peripheral membranes (arrows). D and E are single confocal sections. Scale bars: in A, 40 μm for A,B; in C, 50 μm; in D,E, 5 μm.

