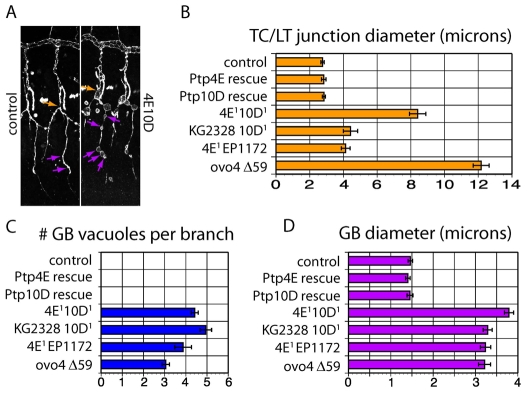
Fig. 3.
Rescue of the phenotype by tracheal expression of Ptp4E or Ptp10D, and quantitation of cyst phenotypes in different genotypes. (A) Stage 15 embryo fillets were stained with anti-Sas to label the tracheae and imaged using confocal microscopy. Tr 4-7 were scored in stage 15 embryos. Measurements were made for the diameters of TC/LT branch junctions (orange arrow) and GBs (purple arrows). In control embryos (Ptp4EKG2328 Ptp10D1/+), two measurements were made per GB, while in mutants all swellings on the branch were measured. (B-D) Expression of wild-type Ptp4E-GFP or Ptp10D in Ptp4E Ptp10D embryos fully rescued the cyst phenotype, as shown by all three bar graphs. There are no GB cysts at all in rescued or control embryos, so no bars are shown in the top three rows of C. All double mutant genotypes displayed similar phenotypes when GB cyst number and GB diameter metrics were evaluated. When TC/LT branch junction diameters were compared, Ptp4E1Ptp10D1 and Df(1)ovo4 Df(1)Δ59 showed larger measurements than the others. See Table S1 in the supplementary material for numerical data. The rescuing Ptp4E-GFP protein was expressed in tracheae and visualized in the experiment of Fig. 1. Ptp4E and Ptp10D alleles: Ptp4E1, N-terminal coding sequences deleted; Ptp4E (KG2328), P-element insertion; Df(1) ovo4, smallest deletion removing Ptp4E; Ptp10D1, N-terminal coding sequences deleted; Ptp10D (EP1172), P-element insertion; Df(1) Δ59, smallest deletion, removes Ptp10D and neighboring bif.

