Figure 2.
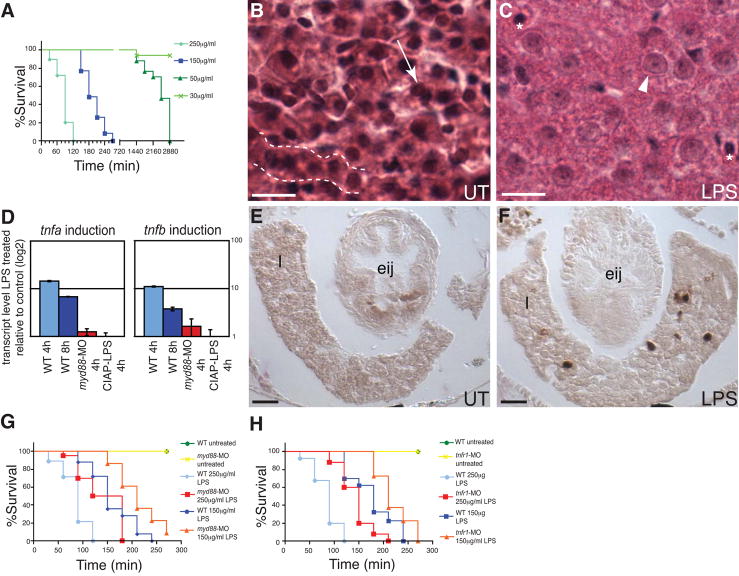
LPS toxicity in zebrafish. (A) Dose-dependent killing of wild-type animals exposed to LPS at 6 dpf. Analysis of survival curves show they are significantly different (Logrank test, P<0.0001). (B–C) H&E stained liver sections of untreated (UT) 8 dpf larvae or exposed to 100μg/ml LPS for 24h. (B) Hepatocytes in B show typical organization in cords (dashed line) with distinct nuclei (arrow). (C) LPS treatment resulted in disorganized tissue morphology, with cell boundaries that are difficult to distinguish and swollen hepatocyte nuclei (arrowhead), in contrast to the normal-sized nuclei of red blood cells (asterisks). Scale bar in panel B,C = 5 μm. (D) tnfa and tnfb transcript levels, assayed by qRTPCR, in WT and myd88-MO injected 7 dpf larvae exposed to 50 μg/ml LPS for 4 or 8 h, or WT exposed to 50 μ/ml CIAP treated LPS for 4 h. Data are representative of two repeated trials, in which all samples were run in triplicate. Error bars indicate standard deviation. (E–F) Mpo stained transverse sections of UT 8 dpf larvae or larvae exposed to 150 μg/ml LPS for 2h at the esophageal-intestinal junction (eij). Mpo-positive cells (dark brown) are present in the liver (1) of the LPS exposed animal in F. Scale bar in panel E,F = 10 μm. (G–H) Survival curves of myd88-MO or tnfr1-MO injected 7 dpf larvae exposed to 150 or 250 μg/ml LPS. Survival curves are significantly different (Logrank test, P<0.0001). n = at least 30 total animals for each sample treatment in at least 2 independent trials. All animals were exposed to LPS at 7 dpf except those in panel A, which all began treatment at 6 dpf to allow for 48 h time period to observe toxic effects of low doses of LPS (30–50 μg/ml) prior to termination of all experiments at 8 dpf.

