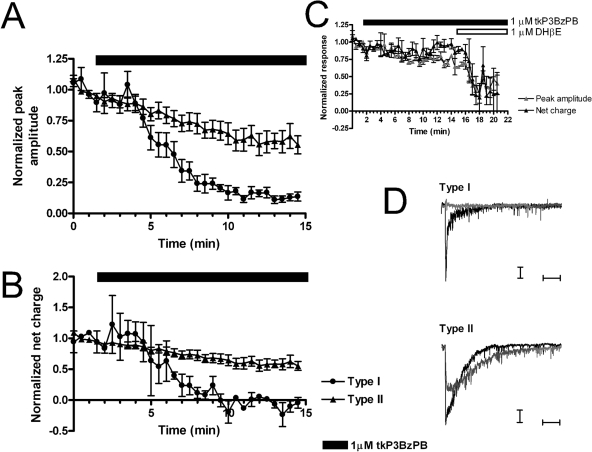
Fig. 10.
Differential inhibition of ACh-evoked responses in septal neurons by tkP3BzPB bath application. Effects of tkP3BzPB bath application on ΑCh-evoked responses on septum neurons are presented in terms of both peak amplitude (A) and net charge (B). Cells were stimulated at 30-s intervals with 1 mM ACh, and after four stable responses (1.5 min), tkP3BzPB was bath-applied. The solid bar represents the time course of the 1 μM tkP3BzPB application. •, type I cells; ▴, type II cells. Type II cells were inhibited by tkP3BzPB to a lesser extent. C, type II cells displayed a nicotinic component sensitive to DHβE block (n = 3). ▵, average normalized peak amplitude; ▴, average normalized net charge responses. Solid bars represent the time course of the 1 μM tkP3BzPB application, whereas open bars represent the time course of 1 μM DHβE application. D, representative traces of 1 mM ACh-evoked responses for type I and type II cells in septum and the inhibition of those responses by tkP3BzPB. Black traces correspond to the average of the ACh baseline responses, and gray traces correspond to the average of the last four ACh-evoked responses at the end of 1 μM tkP3BzPB application. Horizontal bars represent 250 ms. Vertical bars represent 10 pA for type I cells and 20 pA for type II. Data represent the average of 5 neurons for type I and 11 neurons for type II.

