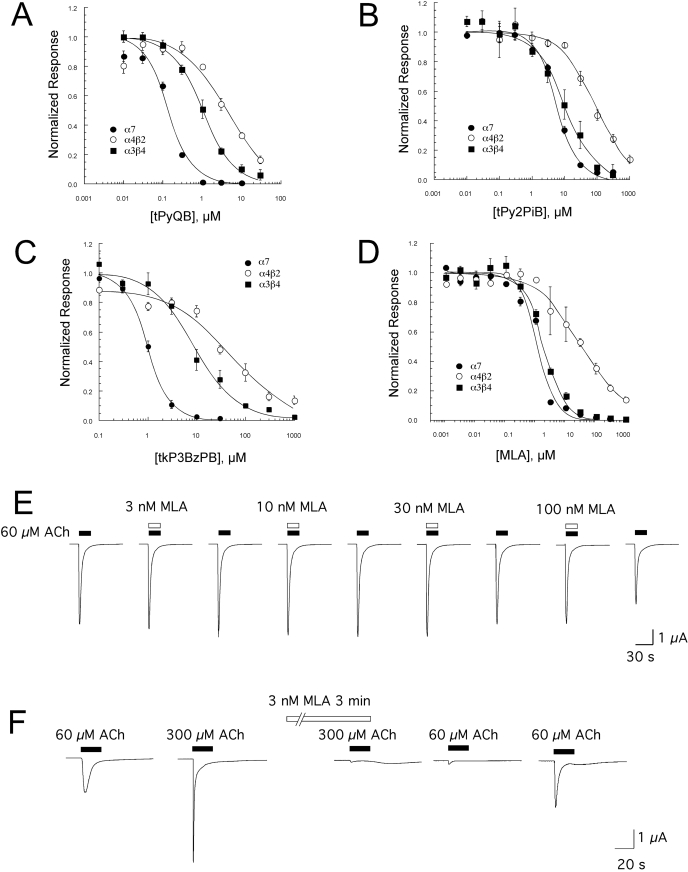
Fig. 4.
Inhibition of nAChR responses expressed in X. laevis oocytes. A to C show the averaged normalized mean data (± S.E.M., n ≥ 4) of net charge responses to coapplication of ACh and a range of concentrations of tris- and tetrakis-AQA analogs from oocytes expressing rat α4β2, α3β4, or α7 subunits: tPyQB (A), tPy2PiB (B), and tkP3BzPB (C). The data were normalized to responses to ACh alone obtained 5 min before the coapplication of ACh and antagonist at the indicated concentrations. ○, α4β2; •, α7; ▪ α3β4. IC50 values are provided in Table 1. D, the averaged normalized mean data (± S.E.M., n ≥ 4) of net charge responses to coapplication of ACh and a range of concentrations of MLA from oocytes expressing human α4β2, α3β4, or α7 subunits. IC50 values are provided in Table 1. E, representative data for the effects of low concentrations of MLA coapplied with 60 μM ACh from oocytes expressing human α7. Coapplications of ACh and MLA alternated with control applications of 60 μM ACh alone at 5-min intervals. Although there was relatively little inhibition during the coapplication of ACh and 100 nM MLA, there was a significant decrease in the subsequent ACh control response. F, the effect of preincubation on increasing the potency of MLA inhibition of α7 nAChR. Shown are responses to 300 μM ACh applied alone before a 3-min incubation with 3 nM MLA, then coapplied with 3 nM MLA. Also shown are control responses to 60 μM ACh before and after the MLA treatment, used to follow the rate of recovery. Note that although the peak amplitude of the final 60 μM response shown is similar to that of the first 60 μM control, the net charge of the responses were significantly less than the initial controls (p < 0.05, n = 5).

