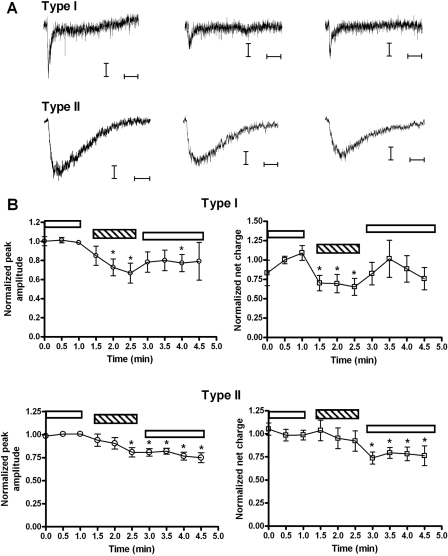
Fig. 9.
Differential inhibition of septal neurons by tkP3BzPB coapplication. To investigate whether the α7-selectivity of tkP3BzPB would discriminate between the nicotinic components of ACh-evoked responses in septal neurons, a double-barreled picospritzer pressure application system was used with one barrel containing 1 mM ACh and the other containing 1 mM ACh + 300 μM tkP3BzPB. A, representative traces for the tkP3BzPB coapplication experiments in septum. Three initial responses to ACh alone were obtained at 30 s intervals; the average response is shown in the left side of A for both types of cells. Three applications separated by 30 s were then made from the barrel containing 1 mM ACh + 300 μM tkP3BzPB, and the average of those traces are presented in the middle section of A. After ACh/tkP3BzPB applications, ACh alone was repeatedly applied at 30-s intervals, and the averages of those responses are presented in the right side of A. Horizontal bars represent 250 ms and vertical bars represent 10 pA. B, peak and net charge responses for type I and type II cells, normalized to the average of the first three responses to ACh applied alone (that were acquired during the interval of time delimited by the white bar on left). Subsequently, cells were given coapplications of ACh and tkP3BzPB (pipette concentrations of 1 mM and 300 μM, respectively). The period of time when coapplications were made is delimited by the hatched bars. After the coapplications, there was a recovery period during which ACh was again applied alone (applications beneath the rightmost white horizontal bars in each plot). ○, peak amplitudes; □, net charge responses. Paired student's t tests were performed to compare the normalized responses during coapplication and recovery to baseline; asterisks denote p < 0.05. Data represent the average of 11 neurons for type I and 17 neurons for type II.

