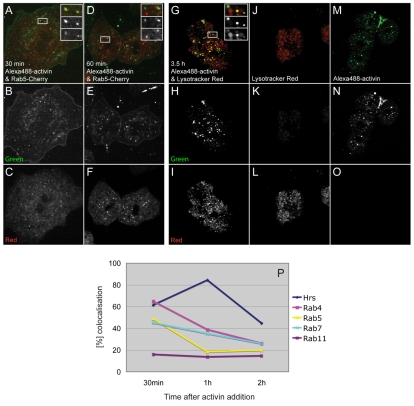
Fig. 6.
Colocalisation studies using Alexa488-activin. (A-F) Confocal images of dissociated Xenopus animal pole blastomeres incubated with Alexa488-activin (green). Early endosomes are marked by the expression of a Rab5-Cherry construct (red). (A-C) Images acquired 30 minutes after a 10-minute treatment with labelled activin. (D-F) Images acquired 60 minutes after a 10-minute activin treatment. (G-I) Confocal images of dissociated animal cap cells treated with Alexa488-activin (green) and counterstained with LysoTracker Red. Images were acquired 3.5 hours after a 10-minute treatment with labelled activin. Insets in A,D,G represent the area outlined in the main part of the image, and show a merged image (top) and images taken using green (middle) and red (lower) fluorescence filters separately. (J-L) Control cells not exposed to Alexa488-activin and counterstained with LysoTracker Red. (M-O) Cells treated with Alexa488-activin only. Images in B,E,H,K,M were acquired using 488 nm excitation and a narrow 521-531 nm filter for green fluorescence emission to reduce background. Images in C,F,I,L,O were acquired using 561 nm excitation and a narrow 601-613 nm filter for red fluorescence emission. All cells were seeded on glass-bottomed dishes that had been coated previously with E-cadherin. (P) Quantitation of colocalisation of Alexa488-activin with the indicated fluorescent markers. An average of ten cells was counted for each point, with each cell containing at least ten aggregates of Alexa488-activin.

