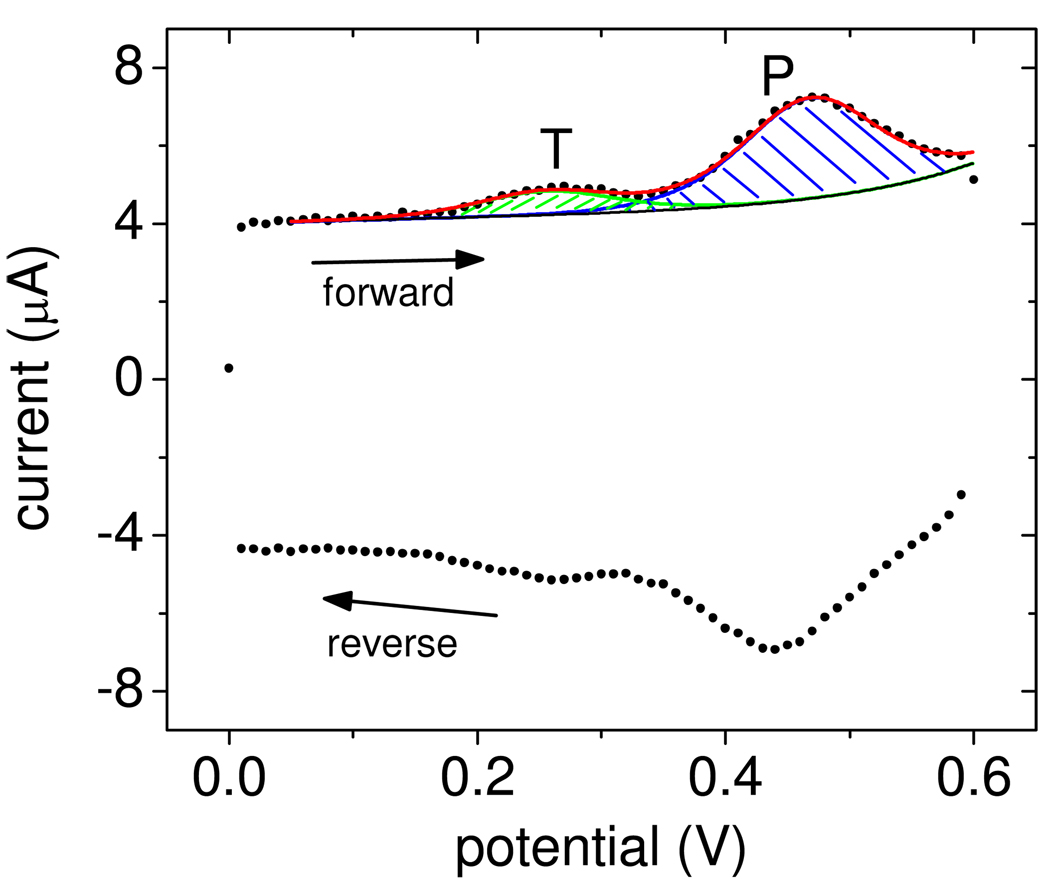
Figure 1.
Points (•): Experimental data. The CV scan starts from 0 V, moves along the forward trace to 0.6 V, and returns to 0 V along the reverse trace. The "T" and "P" peaks are from oxidation of target F2 and probe FC1 tags. The curves are computer-generated fits used to calculate QFC1 and QF2 (Supporting Information). Black line (–): baseline current IB (equation S2, Supporting Information); green line ( ): current IT,F2 from target tags (equation S3); blue line (
 ): current IT,FC1 from probe tags (equation S3); red line (
 ): total current Itot = IB + IT,F2 + IT,FC1.

