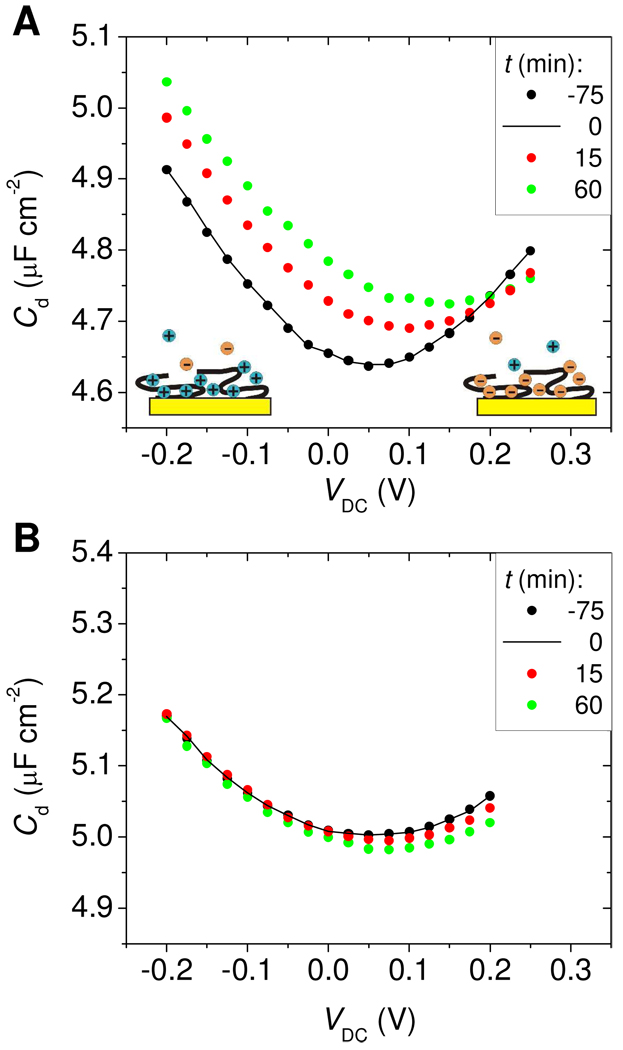
Figure 4.
Cd(VDC) traces as a function of time for (A) Morpholino and (B) DNA probe films. t = 0 (black line) corresponds to introduction of complementary TD1 target and onset of hybridization. Shift in Cd due to baseline drift was corrected relative to t = 0 by plotting Cd(t) = Cd,raw(t) – ( fB(t) - fB(0) ), where fB(t) - fB(0) is the change in baseline between t and 0 min, and Cd,raw(t) is the unprocessed data.

