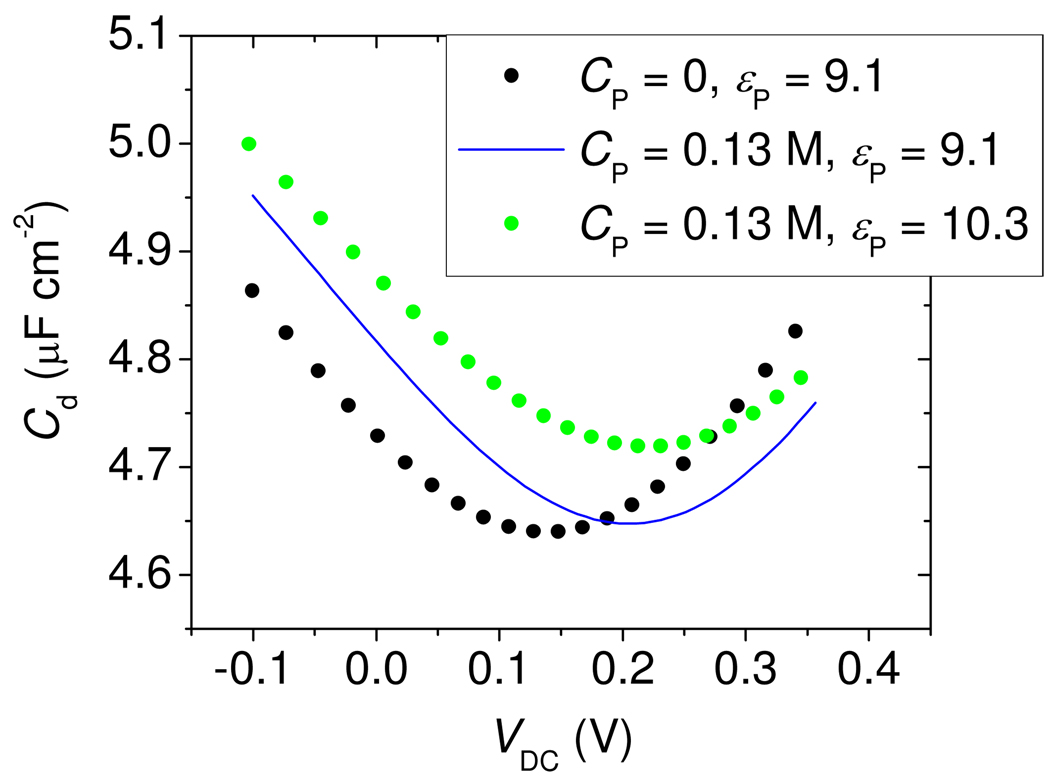
Figure 5.
PB theory calculations, illustrating the effect of (1) an increase in immobilized negative charge CP of the probe layer from 0 (black points) to 0.13 mol L−1 (blue line), and (2) an increase in dielectric constant εP of the probe layer from 9.1 (blue line) to 10.3 (green points). The shape of the curve traced out by the black points corresponds, approximately, to t = 0 data in Figure 4A, while the green trace can be compared to the t = 60 min data. MCP layer parameters: tmcp = 0.67 nm, ε mcp = 4.4, βj,mcp = 1000 for all ions. Morpholino probe layer parameters:. Electrolyte parameters: T = 295 °K, 0.2 mol L−1 pH = 7.0 phosphate buffer.

