
Fig. 8.
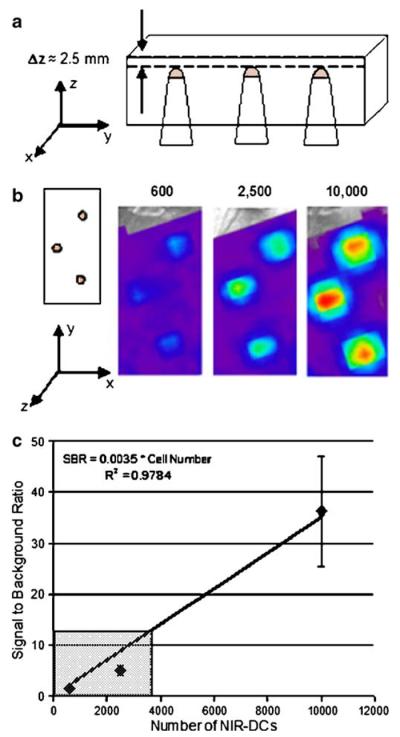
Example of a tissue phantom used to correlate signal-to-background ratio values with the number of NIR-DCs at a specified depth. a Schematic of tissue phantom. Side view showing three Eppendorf tubes placed at equal depths. Each tube contains the same number of cells for n=3. b Top view or imaging surface of tissue phantom adjacent to images collected for each of the three cell concentrations. All cells were placed at a depth of 2.5 mm below the imaging surface. c Signal-to-background ratio versus cell number for the presented images. The gray box indicates the range of signal-to-background ratios observed for popliteal lymph nodes positive for migrating dendritic cells.