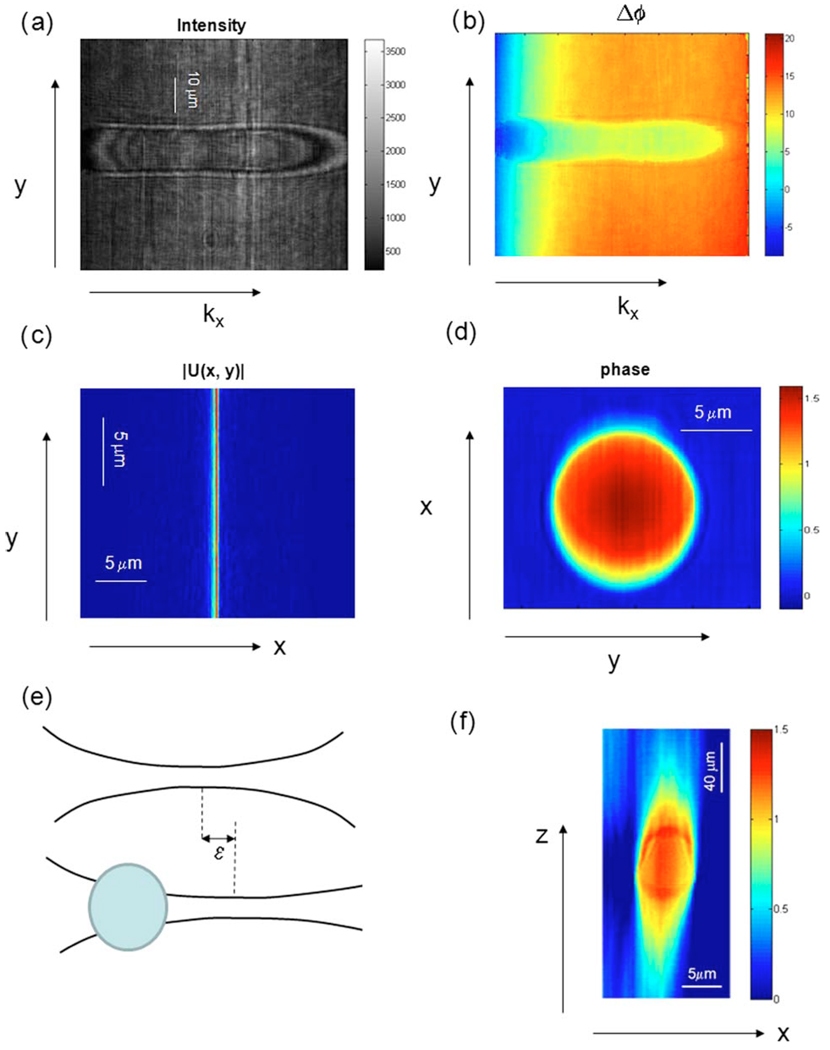
Fig. 2.
(Color online) cDPM image of a 10 µm bead in 1.57, refractive index oil. (a) Fourier interferogram (kx−y). (b) Fourier quantitative phase images of the bead (kx−y). (c) The line imaging field in (x−y) after inverse 1D Fourier transform. (d) Quantitative x−y phase image of the bead. (e) Schematics of the focus shift that explains the elongation along z, as described in text. (f) Quantitative x−y phase cross section.

