
Figure 5.
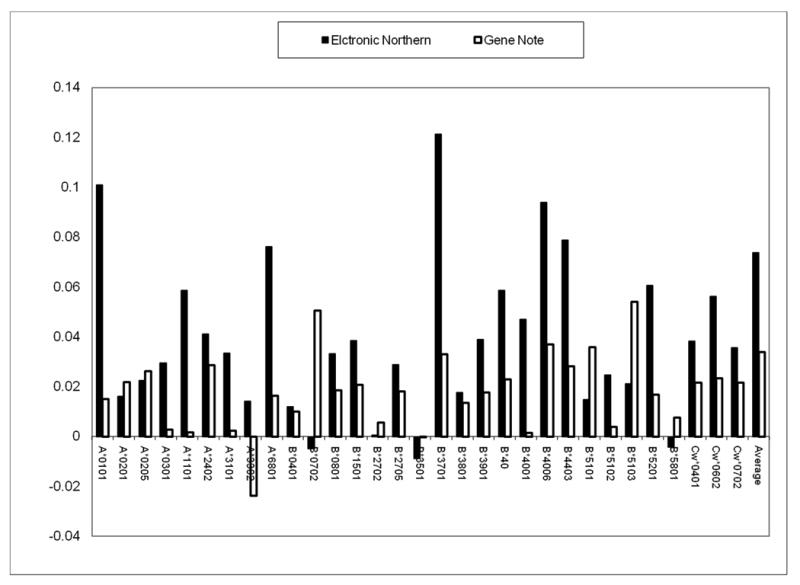
Correlation values between the SIR score and RNA average gene expression for the different alleles and for the weighted average over all alleles. The Y axis is the correlation coefficient with Electronic Northern or GeneNote human expression pattern profiles and the column is the allele. Practically all alleles have a significant positive correlation with the RNA expression level. No allele has a significant negative correlation.