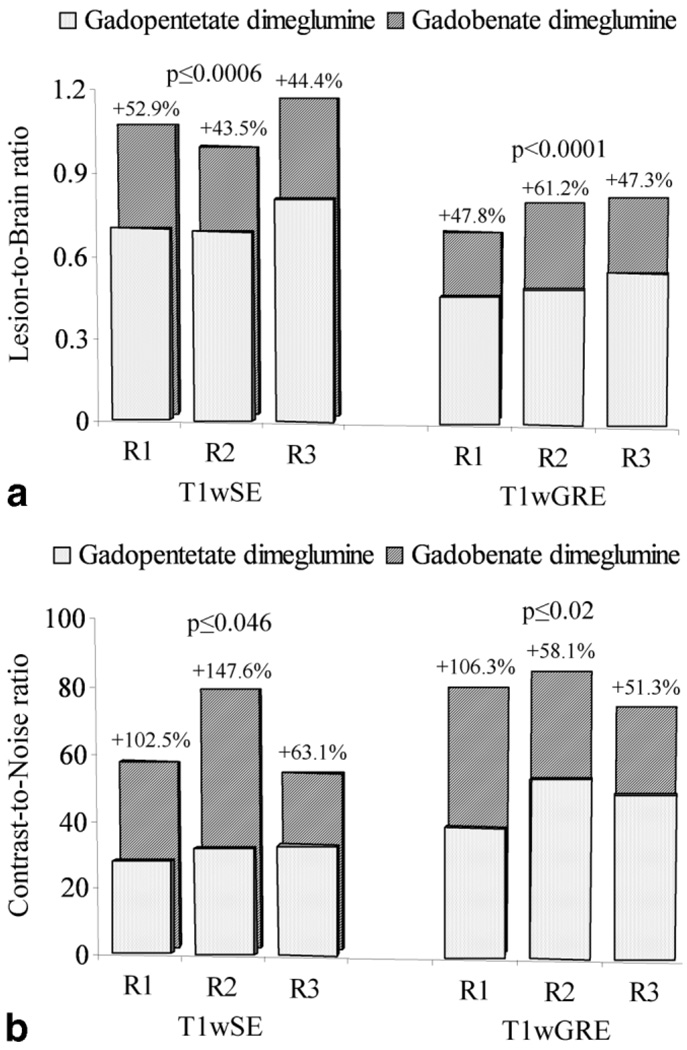
Figure 4.
Bar graphs showing significantly increased mean lesion-to-brain ratios (a) and contrast-to-noise ratios (b) with 0.1 mmol/kg gadobenate dimeglumine compared with 0.1 mmol/kg gadopentetate dimeglumine at 3T using both T1wSE and T1wGRE sequences. Data obtained from quantitative measurements of signal intensity enhancement for all patients at ROIs positioned by each of three blinded readers independently.

