Figure 4.

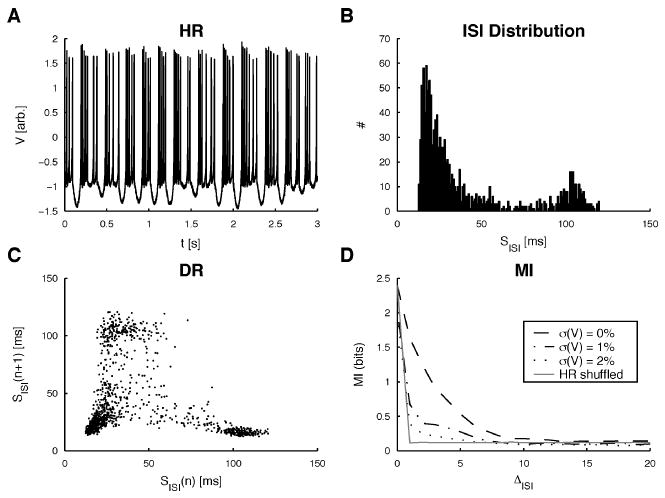
Surrogate data sets from the HR model. (A) Voltage-variable traces from the HR model for 1% noise are shown (voltage value in arbitrary units). (B) ISI histogram for the data in A containing 1200 ISIs. It contains components of IS (broadly decaying) and ST (second interburst ISI peak) histograms. (C) DR of the ISI sequence from A. Some bijective structures, especially in the range of 60 to 120 ms, can be observed, but there are also regions (<60 ms) where no clear dependence is observed. (D) MI of the ISI sequences for three different levels of noise (see section 2 for details) and their RS surrogates. Clearly the ISIs in the original sequences contain more information about the following ISIs than the RS surrogates and the physiologically recorded ISI sequences (see Figure 3C). The first minimum was reached between 8 and 15 ISIs, depending on the noise level. These delays were used for embedding.
