
Fig. 3.
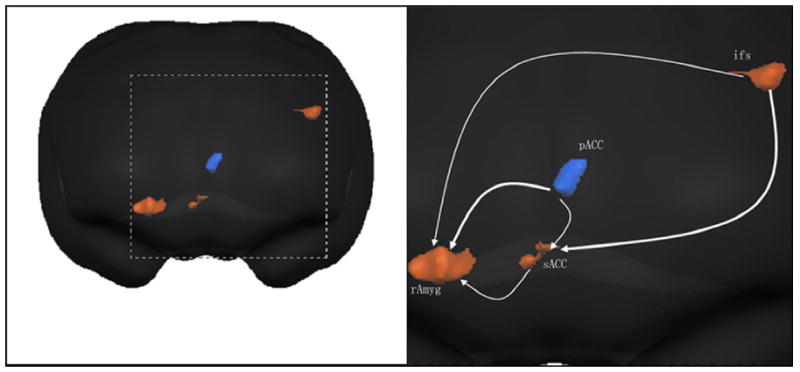
Graphical description of human brain network across conditions. The lines in the Granger causality graphs have arrowheads, indicating the direction of Granger causal influence. Lines between region pairs not reaching significance in the Granger causality measures are not shown. Ifs, inferior frontal sulcus; pACC, pregenual cingulate gyrus; sACC, subgenual cingulate gyrus; rAmyg, right amygdale.