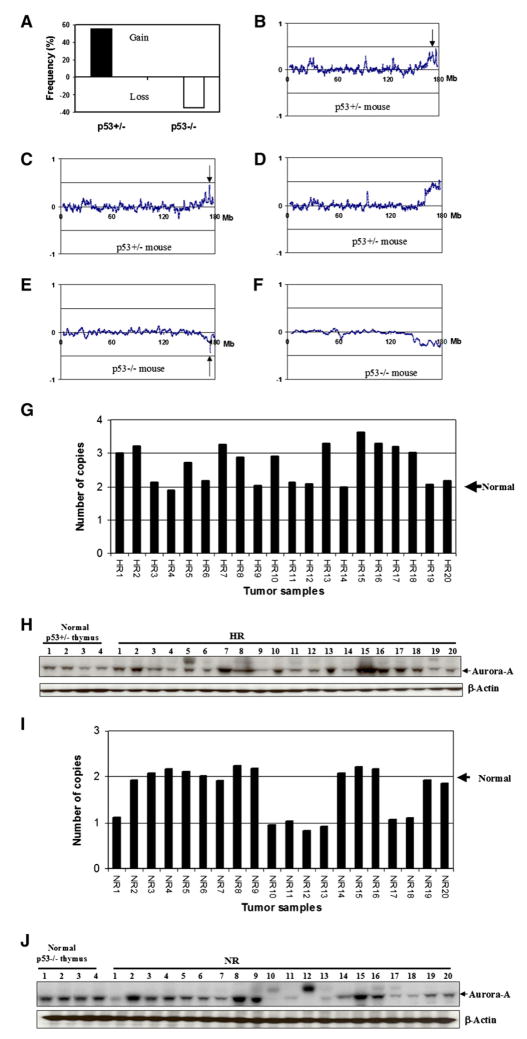
Figure 2. Gene Copy Number Changes at the Aurora-A Locus in Tumors.
(A) Frequency of somatic gain/loss of Aurora-A in lymphomas as a function of p53 status.
(B–D) Representative BAC array profiles of chromosome 2 in tumors from p53+/− mice. The arrows indicate the position of the Aurora-A gene, which is frequently gained in tumors from p53+/− mice.
(E and F) Loss of the Aurora-A gene in tumors from p53−/− mice.
(G) Detection of Aurora-A genetic alterations in radiation-induced tumors from p53 heterozygous mice (HR) by TaqMan assay.
(H) Detection of Aurora-A protein levels in radiation-induced tumors from p53 heterozygous mice (HR) by western blotting. The first four lanes show levels of Aurora-A in normal thymus from unirradiated p53+/− mice. Tumors in lanes labeled HR 1–20 correspond to those labeled HR1–HR20 in (G).
(I) Detection of Aurora-A genetic alterations in radiation-induced tumors from p53 null mice (NR) by TaqMan assay.
(J) Detection of Aurora-A protein levels in radiation-induced tumors from p53 null mice (NR) by western blotting. The first four lanes show levels of Aurora-A in normal thymus from unirradiated p53−/− mice. These are consistently higher than in corresponding p53+/− mice (H). Tumors in lanes labeled NR 1–20 correspond to those labeled NR1–NR20 in (I).

