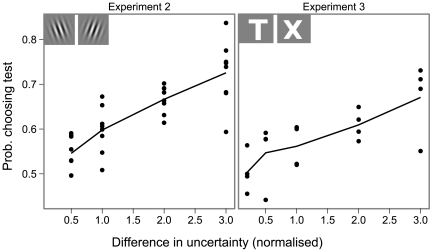
Figure 5. Results of experiment 2 and 3.
In these two experiments, the test and the standard stimuli varied in uncertainty. We plot the proportion of times the test stimulus was chosen as a function of the difference between the uncertainty of the standard and the uncertainty of the test. The dots represent individual results, the solid line is the average over observers. Experiment 2 used orientation discrimination, experiment 3 used letter discrimination. The templates are shown on top of each graph. The levels of uncertainty are standardised across observers, see Text S1.

