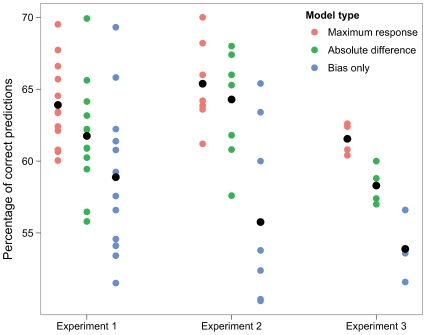
Figure 6. Proportion of correct predictions for three models of choice.
The maximum of response and absolute difference models are presented in the text. Observers presented a bias in their choice of stimuli (most of them choosing the top one with a proportion higher than chance), so we plot the proportion correct of a model that predicts observers always choosing the stimulus to which they are biased (Bias only, see Methods).

